
Deep Analysis
Hyperliquid (HYPE) Institutional Analysis: Spot ETF Catalysts and Price Trajectory for 2026
April 11, 2026
...


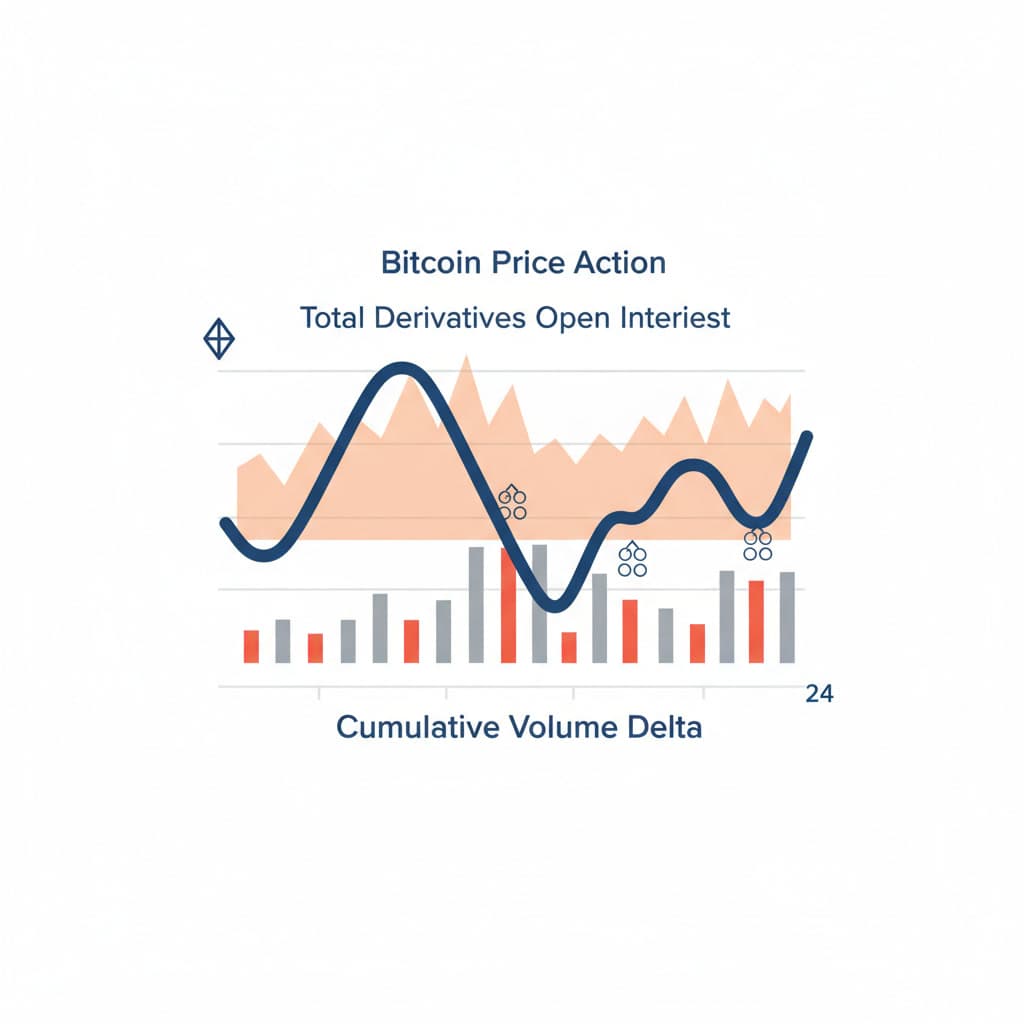
Portfolio managers and institutional allocators managing digital asset exposure face an immediate capital preservation decision: whether to hedge current spot positions against cascading liquidations or deploy dry powder into the recent Bitcoin (BTC) slide to $70,904. Evaluating this risk requires isolating derivatives-induced volatility from fundamental spot market distribution. By analyzing order book depth, cumulative volume delta (CVD), and the behavioral divergence between aggressive retail accumulation and institutional inactivity, this analysis quantifies the probability of a structural market shift. The asset currently trades at a 2.96% intraday deficit, confined to a tight 24-hour range between $70,767 and $73,721. Understanding the structural integrity of this price level requires cross-referencing CME Group's Bitcoin futures data with primary on-chain liquidity metrics.
The breakdown below $71,000 represents a mechanical failure of market makers to defend the primary liquidity node established during late Q1 2026. When price action compresses within a high-volume node, a subsequent breakdown forces a rapid search for the next bid concentration. The absence of thick limit orders between $71,500 and $70,800 allowed algorithmic sellers to push the price down with minimal friction. This thin order book environment amplifies the impact of marginal spot selling, transforming standard profit-taking into a sharp technical breakdown.
Price discovery during this drawdown reveals a stark behavioral divergence across market participants. On-chain metrics tracking wallet cohorts demonstrate that retail participants—entities holding less than one full Bitcoin—are aggressively absorbing the dip. Conversely, large-volume entities controlling over 1,000 BTC remain entirely dormant.
This inactivity implies that institutional whales are either comfortable with their current cost basis or are modeling a deeper liquidity sweep before committing fresh capital. The lack of a unified institutional bid leaves the market strictly dependent on retail inflows, which historically lack the capital density required to absorb sustained selling pressure from automated algorithmic execution.
Derivatives markets currently dictate spot price realities. Total open interest (OI) across major exchanges has swelled to nearly $25 billion. When OI expands while spot prices decline, the market is typically absorbing aggressive short positioning. This creates a mechanical vulnerability: if spot prices reverse upward and breach the aggregate short liquidation price, forced buying will trigger a rapid short squeeze. The sheer density of leveraged contracts near the $72,500 threshold acts as a magnetic pull for market makers seeking to clear liquidity voids.
Perpetual swap funding rates provide the necessary context for this OI expansion. Marginal negative funding confirms that late-stage shorts are paying a premium to maintain downside exposure. Institutional desks must weigh the cost of capital against the probability of a sudden upward repricing.
Institutional ETFs function as primary liquidity sinks. Shifts in ETF net flows directly alter spot market supply, creating friction at major price levels and dictating the pace of recovery when the broader market tests critical support zones. The recent 2.96% drawdown corresponds directly with net outflows from primary US-domiciled Bitcoin ETFs. When authorized participants redeem shares, the resulting spot sales exacerbate downward pressure, overpowering the fragmented retail bid.
Evaluating this drawdown requires cross-asset benchmarking. During the April 2026 trading sessions, institutional allocators demonstrated selective capital rotation. While BTC struggles at $70,904, Ethereum (ETH) demonstrates relative resilience by defending the psychological $2,000 level.
A clear case study of this dynamic is visible in the weekly flow data across multi-asset crypto funds. As macro uncertainty peaked, portfolio managers reduced their heavy BTC weightings, redirecting marginal capital toward Ethereum and Solana ETF products to capture higher beta. This rotation isolates Bitcoin, forcing the primary digital asset to rely strictly on its own decaying spot demand rather than broad sector-wide inflows. Q2 ETH bulls still face structural resistance ahead, but the immediate capital diversion highlights a sophisticated institutional approach to managing crypto-specific beta.
Bitcoin's localized weakness contrasts sharply with the recent performance of traditional equities. Stocks have rebounded aggressively, driven by optimism that a US-Iran ceasefire will hold. Traditional risk premiums compress when geopolitical friction diminishes, reducing the immediate demand for non-sovereign safe-haven assets. Algorithmic macro funds dynamically adjust their portfolios in real-time, reducing their BTC allocations and rebalancing into equities to capture the ceasefire-induced beta.
Looking deeper into Q2 2026, the intersection of monetary policy and geopolitical stability will define the next structural accumulation zone. If the ceasefire holds and global liquidity conditions ease, the current $25B OI will likely resolve through a slow, grinding deleveraging rather than a violent squeeze. Institutional models suggest the market requires a sustained period of low volatility to flush out over-leveraged retail participants before establishing a durable bottom.
A structural market reversal necessitates a complete wipeout of late-stage leverage. The market cannot sustain an upward trajectory while carrying $25 billion in open interest heavily skewed toward unhedged directional bets. Capital allocators must monitor specific technical thresholds to confirm whether the current price action is a temporary deviation or a permanent shift in market structure.
What does a $25 billion open interest mean for Bitcoin price volatility? Elevated open interest indicates a massive concentration of active derivative contracts. Combined with a recent 2.96% price drop, it suggests heavy leverage in the system, increasing the probability of cascading liquidations that trigger rapid, volatile price swings.
How do institutional ETF flows impact spot market discovery during a drawdown? Institutional ETFs function as primary liquidity sinks. Shifts in ETF net flows directly alter spot market supply, creating friction at major price levels and dictating the pace of recovery when the broader market tests critical support zones.
Loading comments...