Deep Analysis
Ethereum at $2,200: Institutional Assessment of On-Chain Metrics and Long-Term Price Dynamics
April 13, 2026
...


During the early Asian trading session on April 14, 2026, algorithmic execution desks at major market makers were observed absorbing heavy spot sell walls on Solana (SOL) across tier-one venues, aggressively defending the $82.78 intraday low. This localized absorption signals a material shift in institutional inventory management, transitioning from passive liquidity provision to active accumulation. Applying institutional order flow analysis and liquidity depth frameworks to the current market structure reveals that Solana’s breach of the $85 threshold is driven by authentic spot accumulation rather than purely derivatives-led speculation. By dissecting the underlying on-chain metrics, validator health, and capital rotation patterns, market participants can quantitatively assess the structural probability of SOL reclaiming the psychological $100 level.
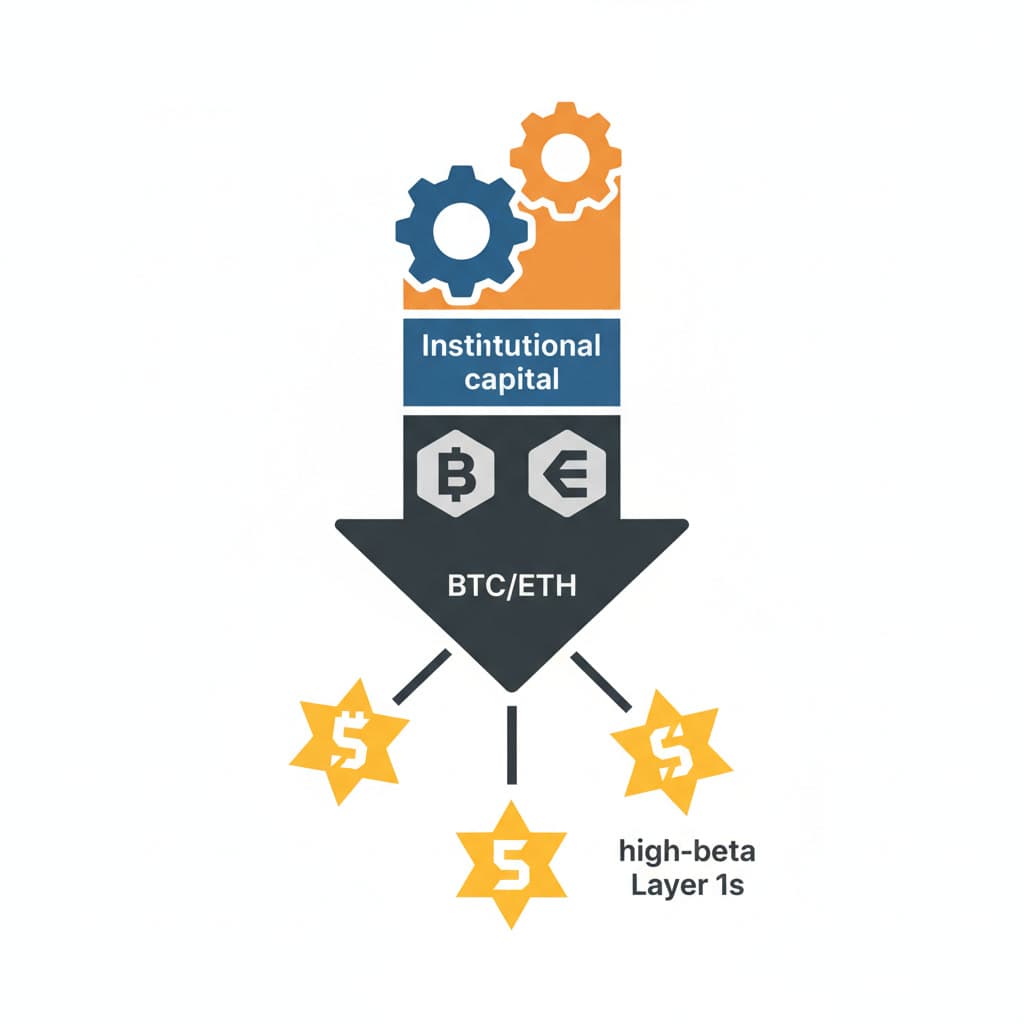
Bitcoin's proximity to the $74,000 mark has fundamentally altered the risk appetite across digital asset markets. Historically, as Bitcoin approaches major resistance or price discovery phases, institutional capital begins a predictable rotation into high-beta Layer 1 networks. Solana currently captures a disproportionate share of this spillover liquidity due to its established order book depth and institutional-grade infrastructure. The recent integration of XRP into the SWIFT ecosystem has validated the utility of high-throughput networks for traditional finance, indirectly boosting the valuation models for Solana's settlement layer capabilities and signaling a broader macro acceptance of non-EVM architectures.
The composition of Solana's derivatives market provides critical insight into the sustainability of the current $85 breakout. Aggregate Open Interest (OI) has expanded, but unlike previous rallies characterized by aggressive leverage, the current funding rate environment remains relatively neutral. Spot market buying is pulling the derivatives market upward, rather than leveraged longs pushing the spot price. A spot-led rally significantly reduces the probability of cascading liquidations, providing a stable foundation for price discovery.
Mini Case Study: Firedancer Integration and Q1 2026 Load Testing The true test of a Layer 1 network's valuation is its performance under extreme load. In Q1 2026, the Solana network faced unprecedented transaction volume driven by decentralized exchange (DEX) routing and automated market maker (AMM) arbitrage. The deployment of the Firedancer validator client—developed by Jump Crypto in C++—has fundamentally altered the network's resilience profile. By eliminating operating system-level thread scheduling inefficiencies and utilizing a modular, tile-based architecture, Firedancer isolates network processing from consensus logic. This effectively minimizes latency spikes during peak load. This architectural upgrade ensures that even as transaction throughput scales toward institutional demands, the network avoids the congestion-induced degradation that plagued its earlier iterations, directly supporting higher baseline valuations.
Validator health is inextricably linked to supply dynamics. Currently, a significant majority of the circulating SOL supply remains locked in staking contracts, securing the network while simultaneously constraining liquid supply on centralized exchanges. This high staking ratio creates a structural supply shock; as institutional demand increases, the available float is insufficient to absorb the buy pressure without upward price adjustments. The introduction of liquid staking tokens (LSTs) has mitigated some of this friction by unlocking capital efficiency in decentralized finance (DeFi) protocols, yet the underlying SOL remains tethered to network security, establishing a firm price floor.
The trajectory toward $100 is obstructed by historical supply zones established during previous market cycles. Order block analysis indicates a dense concentration of underwater positions between $95 and $105. Market participants who accumulated at these levels previously often act as a ceiling, executing break-even sell orders as price approaches their initial entry. Overcoming this resistance requires sustained spot volume to absorb the latent sell pressure.
Despite the bullish momentum, quantitative models flag potential bearish structural warnings. Divergences in relative strength indicators on higher timeframes suggest that the current momentum may face exhaustion if macro conditions deteriorate. Sudden shifts in central bank liquidity policies or unexpected inflation data could prompt a rapid de-risking event, invalidating the technical breakout. The probability of a catastrophic reversal is currently mitigated by the robust spot accumulation observed at the $82 support level, but risk managers must heavily weight macro-correlation in their near-term execution algorithms.
Sustainable price appreciation throughout 2026 and beyond relies entirely on developer retention and the expansion of the application layer. Solana's ecosystem metrics demonstrate robust growth, supported by initiatives like the global Colosseum hackathons that continuously funnel engineering talent into the network. The focus has shifted from simple token issuance to complex financial primitives, including on-chain order books, synthetic asset protocols, and real-world asset (RWA) tokenization. This maturation of the developer ecosystem ensures that the network generates intrinsic value independent of speculative trading.
The total value locked (TVL) within Solana's DeFi ecosystem serves as a lagging indicator of institutional confidence. Yield generation strategies have evolved beyond inflationary token emissions to rely on real yield generated from transaction fees and MEV capture. The proliferation of USDC settlement on Solana highlights the network's utility as a high-speed payment rail. As traditional financial institutions increasingly demand capital-efficient yield strategies, Solana's DeFi infrastructure is positioned to absorb a significant share of this institutional liquidity, reinforcing the fundamental case for sustained valuation growth.
Solana demonstrates structural strength above the $85 threshold, backed by robust network activity and authentic spot accumulation. The integration of high-performance validator clients and the expansion of the DeFi ecosystem provide a fundamental floor for current valuations. Market participants must monitor the immediate $87 resistance test and broader macro dominance metrics to validate the final push toward the $100 psychological level. The interplay between on-chain utility and institutional capital rotation will dictate the sustainability of this trajectory throughout 2026.
What specific macro indicators suggest Solana could reclaim $100? A sustained increase in aggregate open interest combined with a positive funding rate environment points to aggressive institutional bidding. Continued network stability under high transaction loads also validates higher fundamental valuations.
How does the current $85 breakout compare to previous resistance tests? The recent breach of $85 is supported by higher spot volumes rather than being purely derivatives-driven. This shift indicates authentic spot accumulation by larger entities building long-term positions.
Loading comments...