Deep Analysis
Ethereum at $2,134: Evaluating Support Dynamics and Institutional Whale Accumulation
March 23, 2026
...


Portfolio managers and digital asset allocators currently face a binary liquidity event: determining whether to aggressively bid Solana (SOL) at its current $89.26 valuation or step aside as the asset tests a highly contested structural floor. The $85 threshold is not merely a psychological line in the sand; it is the absolute boundary separating institutional accumulation from a cascading retail liquidation event. To navigate this risk, I will dissect the underlying network fundamentals stabilizing this price action, specifically contrasting the recent $136 million in cumulative weekly inflows against the technical exhaustion signaled by a rising wedge formation.
The defense of the $85 support level over the past week was not a product of retail conviction. It was a calculated absorption of sell-side pressure by institutional entities executing systematic accumulation strategies. While broader risk assets retraced following the Federal Reserve’s hawkish pause, capital flows into Solana exhibited a distinct decoupling from macroeconomic gravity.
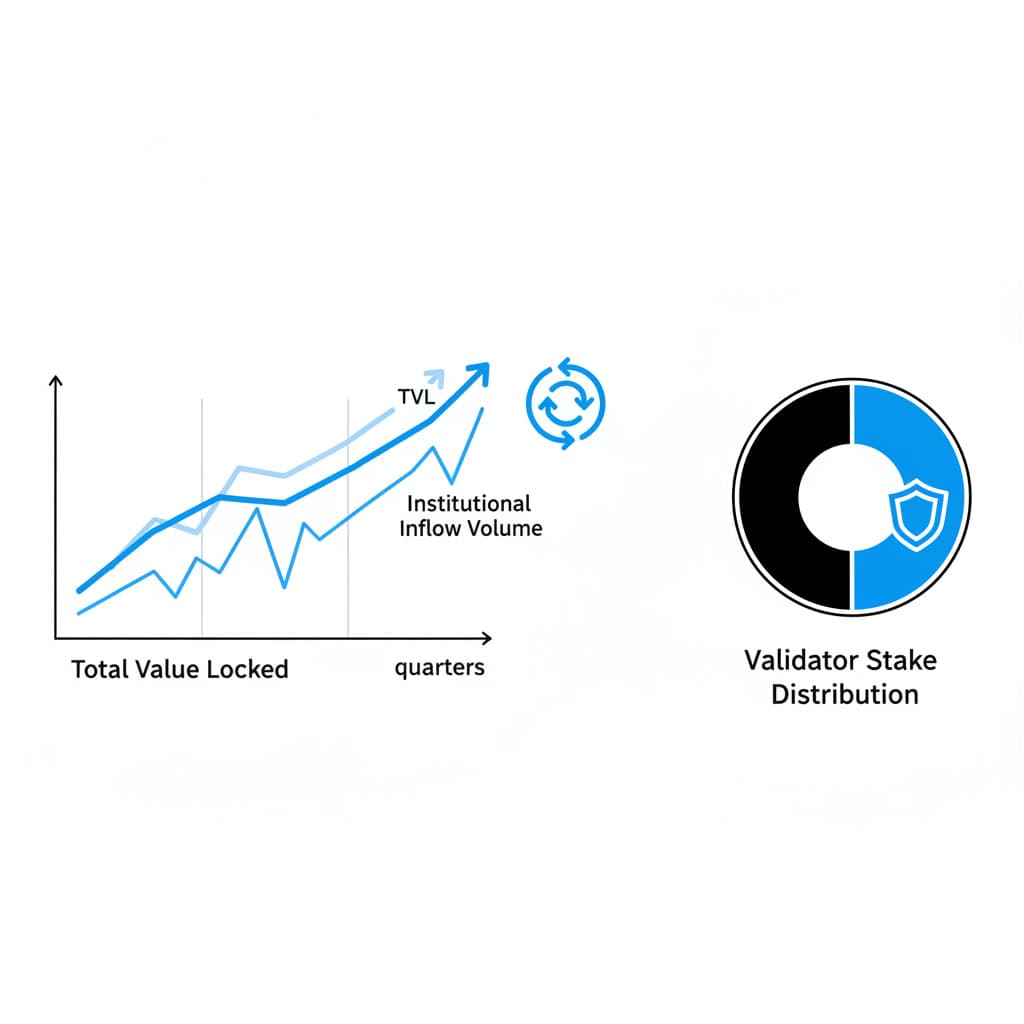
Data from CoinShares reveals a stark divergence in institutional capital allocation. While Ethereum experienced $27.5 million in outflows snapping a three-week positive streak, Solana registered its seventh consecutive week of net inflows, adding $17 million to reach a cumulative $136 million. This rotation is highly irregular for a late-cycle tightening environment. Institutional allocators are actively treating SOL as a high-beta portfolio diversifier, betting that its localized yield opportunities outweigh the overarching duration risk imposed by sustained high interest rates.
The inflow anomaly suggests that institutional desks are not trading the spot price; they are acquiring the asset to deploy into staking and decentralized finance (DeFi) primitives where the structural yield offsets spot volatility.
Beneath the surface, the order book architecture around $85 reveals heavy defensive posturing. Liquidity providers (LPs) on decentralized exchanges (DEXs) have concentrated massive bid walls just above the $85 handle, fully aware that leveraged long positions have clustered their stop-losses between $82 and $84.50.
Map of Incentives: The $85 BattlegroundA token’s price action is ultimately a derivative of its network economy. Solana’s fundamental metrics in Q1 2026 present a paradox: record-breaking on-chain activity paired with lagging protocol revenue capture.
Solana processes over 2 billion transactions monthly and supports roughly 3.2 million daily active wallets. Yet, the network faces a severe value capture problem. Despite generating over $1.5 trillion in DEX volume in 2025, protocol fees remain disproportionately low compared to the economic velocity moving through the chain. High throughput and sub-cent fees are excellent for user acquisition but terrible for token value accrual. If a network requires massive inflation to subsidize validator security because transaction fees cannot cover the operating costs, the institutional thesis begins to fracture.
Mini Case Study: Jupiter Lend's Capital Absorption Consider the ecosystem's internal liquidity dynamics. In February 2026, Solana's stablecoin supply hit an all-time high of $15.7 billion. Much of this capital remained dormant until protocols like Jupiter Lend exited beta. Jupiter Lend successfully absorbed a portion of this latent liquidity, reaching 83,000 active users with zero bad debt. This demonstrates that when institutional-grade infrastructure is deployed on Solana, the idle stablecoin capital rapidly rotates into productive yield generation, locking up SOL as collateral and functionally reducing the liquid circulating supply.
The competitive landscape has shifted dramatically. Solana is no longer just competing with Ethereum's base layer; it is competing against highly optimized Ethereum Layer 2 rollups and parallelized EVM chains.
Solana maintains a strict advantage in atomic composability—a feature fractured by the bridged architecture of Ethereum's L2 ecosystem. However, to maintain its market share, Solana must prove that its monolithic architecture can scale without suffering hardware bloat that centralized the validator set.
Technical structures rarely dictate fundamental reality, but they heavily influence algorithmic trading behavior. The rising wedge currently dominating SOL’s daily chart is a textbook exhaustion pattern, characterized by converging trendlines and diminishing volume on upward price thrusts.
Historically, when Solana has printed rising wedges on the macro timeframes—most notably in late 2021 and mid-2024—the subsequent breakdowns resulted in 30% to 40% drawdowns. The pattern indicates that buyers are expending increasing amounts of capital to achieve diminishing marginal gains in price. The fact that SOL is currently trading at $89.26, having briefly pierced the lower bound of the wedge, suggests the asset is existing on borrowed time unless a fundamental catalyst forces a structural invalidation.
The most alarming metric is the volume divergence. As SOL attempts to push back toward the $95 mid-range, spot purchasing volume has steadily declined. This divergence signals that the recent defense of $85 was likely driven by passive limit orders being filled rather than aggressive market buying. Going into Q2 2026, this lack of aggressive bid-side liquidity means any macroeconomic shock—such as an unexpected CPI print or further geopolitical escalation—could easily slice through the $85 floor, exposing the next major liquidity pocket down at $60.
Venture capital models do not price assets based on current spot dynamics; they price them based on network terminal value. For Solana to justify a sustained re-rating above its current stagnation, two specific fundamental vectors must align over the next four years.
Solana’s centralization vector is the primary risk premium priced into the asset by institutional risk committees. The active validator count has collapsed from a peak of over 2,500 to approximately 795 as of early 2026. The unit economics of running a Solana node are currently hostile. High hardware costs, coupled with a depressed token price and concentrated stake distribution (where the top 19 validators control roughly 33% of the network), are squeezing independent operators out of the ecosystem.
If the upcoming Firedancer client upgrades fail to drastically reduce hardware requirements, the network risks becoming a high-performance oligopoly.
Reclaiming the $100 resistance requires more than just surviving technical breakdowns; it requires a structural shift in how value is captured on-chain.
To break the $100 barrier, the TVL must expand beyond the current $7 billion, driven not by asset price appreciation, but by net-new capital deposits. The ecosystem must transition from relying on speculative token trading to capturing revenue from real-world asset (RWA) tokenization and institutional stablecoin settlement.
Final assessment on Solana's risk-reward ratio at $89.26: The asset is currently entirely dependent on institutional inflows masking retail exhaustion. While the $136 million inflow anomaly provides a temporary buffer, the long-term viability of breaching the $100 barrier relies entirely on the successful deployment of the Firedancer upgrade to fix validator unit economics, alongside a dovish shift in macroeconomic liquidity. Allocators should treat the $85 level as a hard invalidation point for any near-term bullish thesis.
The $85 threshold represents a major historical liquidity pocket and a structural pivot point. A sustained breakdown below this level triggers automated stop-losses from leveraged positions, potentially initiating a cascading liquidity event across decentralized exchanges.
Sustained institutional capital, such as the recent $136 million weekly inflows, absorbs excess sell pressure generated by retail distribution, functionally flattening the downside volatility typically associated with rising wedge breakdowns.
Loading comments...