Deep Analysis
Bitcoin Macro Dynamics: Stagflation Hedges and the $70K Resistance Barrier
March 22, 2026
...


Institutional allocators and venture funds currently face a binary risk management decision: whether to deploy capital into Ethereum (ETH) at its $2,134 support zone or construct delta-neutral hedges against a cascading liquidity event below the $2,000 psychological threshold. By examining the structural divergence between retail derivative positioning and verified institutional spot accumulation, we can accurately underwrite the integrity of this pricing floor.
The current macroeconomic environment, combined with localized on-chain data from Etherscan and derivatives metrics from Coinglass, reveals a market in transition. Retail capital is repeatedly trapped in high-leverage long positions, while sophisticated entities systematically drain exchange reserves.
Understanding the current $2,134 valuation requires deconstructing the failed breakout attempt that preceded it. Price action alone rarely tells the full story; the underlying order flow dictates structural strength.
The aggressive push toward $2,400 earlier this month possessed all the hallmarks of a low-quality, derivative-led rally. Rather than being driven by spot market accumulation, the advance was fueled by perpetual futures traders aggressively bidding up funding rates. When the basis premium expanded beyond historical norms, market makers stepped in to harvest the spread, heavily shorting the perpetual contracts while buying spot to remain delta-neutral.
Once retail buying exhaustion set in, the absence of passive spot bids exposed the fragility of the move. A minor macro trigger initiated a sequence of forced liquidations, driving ETH back toward the $2,100 range.
At the current price of $2,134.61, the market is navigating a precarious localized floor. Open interest remains stubbornly high relative to market capitalization, indicating that speculative capital has merely repositioned rather than exited.
If ETH breaks below the $2,030 daily low, it risks triggering a cascade of stop-market sell orders. Derivative exchanges cluster liquidation engines around round numbers; a breach of $2,000 would likely force automated selling, temporarily dislocating the spot price from its fundamental value before institutional limit orders can absorb the shock.
While retail traders attempt to catch falling knives using leverage, enterprise-grade capital is executing a vastly different playbook. The on-chain footprint shows a methodical rotation of assets from liquid exchanges to illiquid staking contracts.
A clear indicator of smart money conviction materialized this week when a dormant early Ethereum whale accumulated $19.5 million in ETH purchases. Entities of this size do not execute market orders; they utilize algorithmic execution strategies—specifically Time-Weighted Average Price (TWAP) and Volume-Weighted Average Price (VWAP)—to absorb liquidity without alerting high-frequency trading firms.
This behavior signals a belief that the downside risk below $2,000 is asymmetric compared to the upside potential heading into the latter half of 2026. When legacy wallets resurface to accumulate rather than distribute, it historically precedes a reduction in circulating supply elasticity.
The accumulation thesis is further validated by corporate treasury actions. A prime case study is Bitmine, which recently expanded its Ethereum staking operations despite the broader market drawdown. By locking ETH into validator nodes, corporate entities are prioritizing baseline yield generation (consensus and execution rewards) over short-term price volatility.
Map of Incentives: The $2,100 Support ZoneEthereum does not exist in a vacuum. Its price action is tightly coupled with broader geopolitical shifts and the gravitational pull of Bitcoin's liquidity cycles.
Recent spikes in crypto market volatility have been heavily influenced by political rhetoric, notably the "Trump trigger" which temporarily pushed Bitcoin past $71,000 and dragged high-beta assets like Ethereum and XRP upward. Regulatory posturing ahead of the 2026 midterm elections is forcing institutional capital to reprice regulatory risk.
When political figures signal favorable frameworks for digital assets, Ethereum benefits disproportionately due to its classification ambiguity. However, these news-driven spikes are often faded by algorithmic trading desks, resulting in the erratic price action currently observed.
Ethereum's localized support at $2,134 is currently being stress-tested by cross-asset contagion. Broad market liquidations in the Bitcoin ecosystem naturally spill over into Ethereum as multi-strategy funds are forced to de-risk their entire portfolios to meet margin calls.
Despite this headwind, ETH has maintained a comparatively tighter 24-hour trading range ($2,030.61 - $2,186.90). This relative strength indicates that Ethereum-specific demand is partially offsetting the macro selling pressure imported from Bitcoin's volatility.
Beyond market psychology and derivative positioning, the base layer's economic model provides a quantifiable bedrock for its valuation.
The primary metric for Ethereum's utility is the retention of capital within its Layer 2 (L2) scaling solutions. Networks like Arbitrum, Optimism, and Base operate as massive sinks for ETH. Even as the spot price corrects, the Total Value Locked across these rollups has shown remarkable stickiness.
Capital deployed in decentralized finance (DeFi) protocols on L2s is sticky because it is actively generating yield or facilitating commerce. This reduces the velocity of ETH, ensuring that a significant portion of the supply is unavailable for immediate liquidation on centralized exchanges.
Volatility inherently drives network usage. As traders rush to adjust collateralized debt positions or execute decentralized exchange swaps during market dips, base fees spike. Thanks to EIP-1559, a portion of these transaction fees is permanently burned.
This creates a counter-cyclical defense mechanism: heavy selling pressure generates high gas fees, which accelerates the ETH burn rate. At localized bottoms, the network often becomes deflationary, actively destroying supply precisely when demand is theoretically weakest.
Capital allocators must structure portfolios based on probabilistic outcomes rather than absolute certainties. The data suggests two primary structural paths for Ethereum over the next two quarters.
For Ethereum to reclaim its bullish trajectory and target the $3,500 liquidity node, the market requires a sustained period of spot-driven accumulation to absorb the overhang of underwater long positions.
The primary catalyst for this advance will likely be a decoupling of ETH from BTC volatility, driven by a surge in institutional staking adoption and a definitive regulatory clearing event. If the $2,100 floor holds through the current liquidation cycle, the resulting short squeeze could rapidly propel the asset past the $2,800 resistance, forcing sidelined capital to chase the momentum.
Conversely, risk models must account for a failure of the $2,000 support. If macro equities experience a sudden drawdown, or if an idiosyncratic shock hits the crypto sector, the liquidation of leveraged longs could drive ETH into the $1,750 to $1,850 range.
This zone represents the next major volume node and the average cost basis for institutional buyers who entered the market in late 2023. A breach of $2,000 should be viewed not as a fundamental failure of the protocol, but as a mechanical liquidity sweep—an optimal entry point for funds operating with a multi-year time horizon.
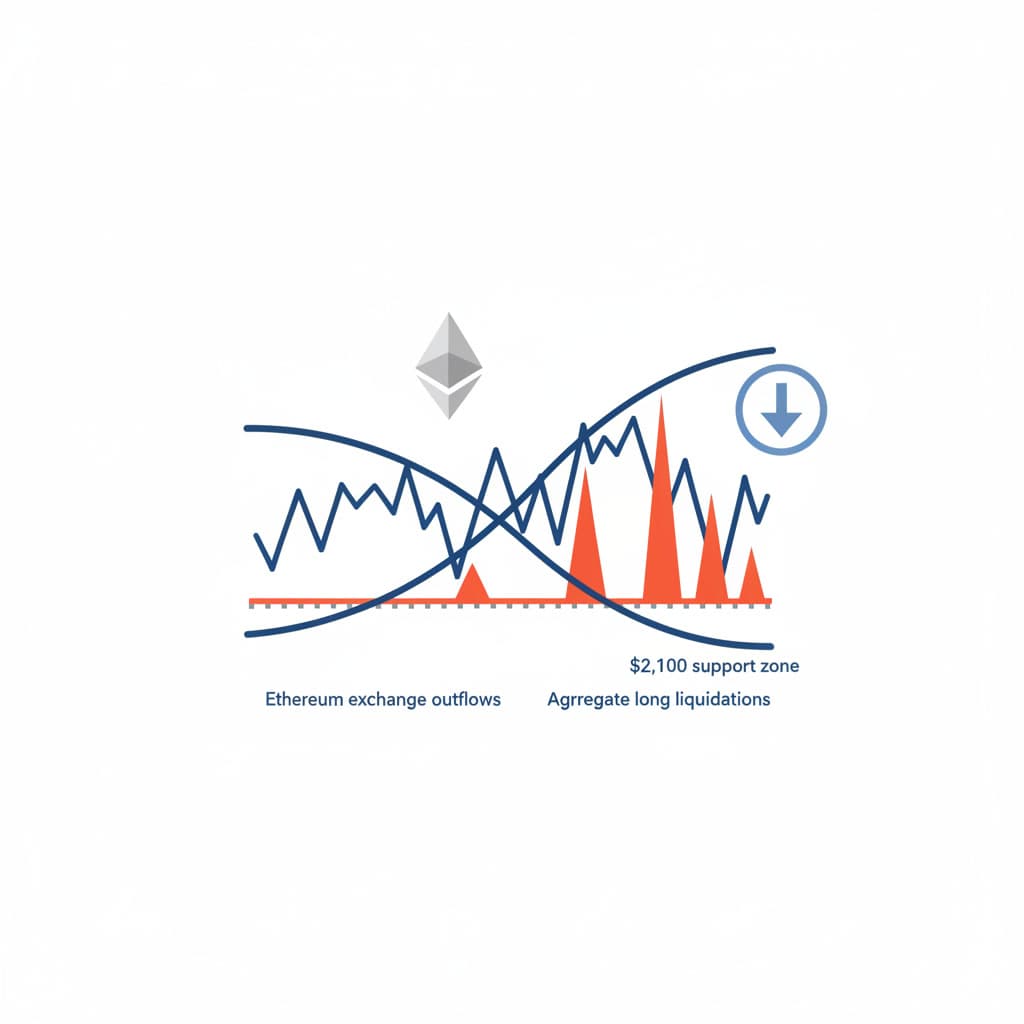
A calculated assessment of the risk-to-reward ratio at $2,134 suggests that while short-term volatility remains elevated due to derivative leverage, the underlying supply dynamics heavily favor accumulation. Monitoring the divergence between exchange outflows and open interest will provide the most reliable leading indicator for the next major directional move.
What differentiates the current Ethereum price floor from previous structural tests? Current support is heavily reinforced by institutional staking lockups and localized whale accumulation, absorbing immediate sell-side pressure more effectively than in previous market cycles.
How do elevated long squeeze risks affect short-term trading strategies? High leverage ratios at the $2,100 mark create a fragile local floor. A sudden breach could cascade stop-losses, making delta-neutral hedging or cautious spot accumulation preferable to highly leveraged long entries.
Loading comments...