
Deep Analysis
Peanut the Squirrel (PNUT) Market Structure: Evaluating the $0.039 Support Level and Liquidity Dynamics
March 29, 2026
...


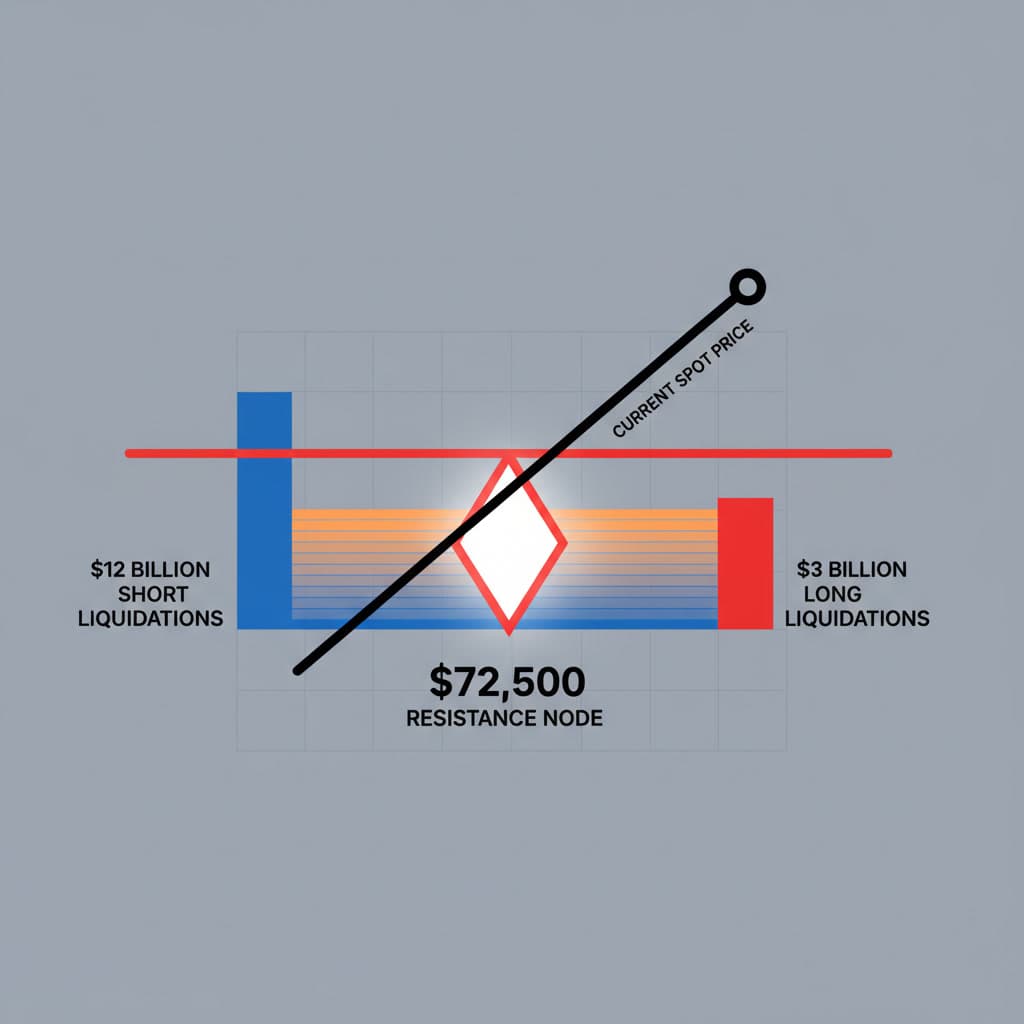
A staggering $12 billion asymmetry currently stalks the Bitcoin derivatives market, dwarfing the $3 billion in long open interest and creating one of the most coiled liquidity springs seen in the 2026 trading year. This 4:1 short-to-long liquidation overhang matters because it dictates that any upward spot volatility will not merely be organic price discovery, but a mathematically forced cascade of buy-to-cover orders. Applying a quantitative microstructure framework alongside regulatory capital analysis, this assessment evaluates the structural integrity of the $66,446 spot price. We are operating in an environment where on-chain metrics clash with aggressive Wall Street fee compressions, demanding a rigorous separation of signal from noise.
For real-time institutional positioning data, quantitative desks rely heavily on CME Group Cryptocurrency Metrics and SEC EDGAR Filings to track these shifting tectonic plates.
Bitcoin currently hovers around $66,446, testing a critical liquidity zone amid rising macroeconomic tension. The resilience of this specific price tranche is not accidental; it is heavily fortified by algorithmic resting orders and institutional accumulation patterns.
Recent quantitative models from Goldman Sachs indicate a potential local bottom forming in the mid-$60K range. This assessment is derived from the exhaustion of short-term holder selling pressure and a stabilization in the realized volatility premium. When institutional desks measure selling exhaustion, they look at the volume of coins moving at a loss compared to historical capitulation events. Current metrics show that the entities offloading BTC at $66,000 are primarily speculative retail participants, while large-wallet cohorts are quietly absorbing the variance. This absorption creates a rigid floor, transforming the $65,000 region from a psychological support level into a mathematically dense bid wall.
Analyzing the centralized exchange order books reveals a distinct shift in market maker behavior. Passive bids have thickened significantly between $64,800 and $65,500. This density acts as a shock absorber against sudden macroeconomic shocks.
The absorption rate—measured by how quickly market sell orders are filled without moving the bid price down—remains exceptionally high near $65,000. This indicates that liquidity providers are willing to take on inventory risk at this threshold, confident in the medium-term upward trajectory.
The defining characteristic of the current market structure is the extreme leverage imbalance. The derivative markets are heavily skewed, setting the stage for violent price action.
Perpetual swap funding rates have intermittently dipped into negative territory despite the spot price remaining historically elevated. This discrepancy highlights a deeply entrenched bearish bias among derivative traders who are aggressively shorting the asset to hedge macro risks or speculate on a deeper correction. However, this heavy short positioning creates a structural vulnerability. With $12 billion in short liquidations clustered aggressively between $68,500 and $71,000, the market is highly susceptible to a short squeeze. If the spot price breaches the initial liquidation triggers, the resulting forced liquidations will automatically execute as market buy orders, creating a self-sustaining feedback loop.
A cascading liquidation event requires a specific catalyst to ignite the initial short-covering rally. Potential triggers include an unexpected dovish pivot from global central banks, a sudden acceleration in spot ETF inflows, or a geopolitical development that drives capital into non-sovereign bearer assets. Once the $68,500 threshold is breached, the friction in the order book disappears. The sheer volume of the $12 billion short overhang guarantees that market makers will widen spreads to protect their own books, exacerbating the upward velocity and violently dragging the price toward the $72,500 macro resistance barrier.
Wall Street's integration of digital assets has shifted from a battle for approval to a ruthless war for market share. The primary weapon in this phase of institutional adoption is fee compression.
Morgan Stanley has initiated a 'semi-shock' strategy by pricing its impending Bitcoin ETF 44 percent cheaper than BlackRock’s dominant IBIT product. This aggressive undercutting fundamentally alters the capital allocation calculus for fiduciary advisors. In the hyper-competitive world of Exchange Traded Funds, a 44 percent fee reduction is not a marginal adjustment; it is a structural disruption.
Consider a registered investment advisor (RIA) managing a $5 billion portfolio with a 2% allocation to Bitcoin. The compounding difference in management fees over a ten-year horizon dictates that the RIA must, by fiduciary duty, transition capital to the lower-fee vehicle assuming tracking error and liquidity remain comparable. This forces BlackRock and other early entrants to either match the fee reduction or risk massive capital flight.
Map of Incentives: Who wins and who loses in this aggressive fee compression?
This fee war accelerates the transition of BTC from a speculative trading vehicle into a foundational, buy-and-hold portfolio asset.
While the foundational metrics are strong, Bitcoin faces formidable overhead resistance dictated by global macroeconomics. The $72,500 level is not just a technical line; it is a psychological and structural ceiling.
Rising geopolitical tensions create a complex dual narrative for BTC. On one hand, its decentralized nature appeals to capital fleeing localized fiat debasement and sovereign risk. Conversely, during acute liquidity crises, algorithmic risk-parity funds indiscriminately sell all highly volatile assets, including Bitcoin, to meet margin calls in traditional markets. This "dash for cash" dynamic periodically suppresses Bitcoin's digital gold narrative, capping its upside during moments of extreme global uncertainty.
On-chain realized price distribution confirms the severity of the $72,500 resistance node. A massive cluster of Unspent Transaction Outputs (UTXOs) was created in this zone during previous rallies. Investors who bought at the local top are utilizing any return to this price level as a break-even exit liquidity event. Overcoming this prolonged resistance requires sustained, multi-week capital inflows that outpace the historical distribution from these trapped buyers.
Looking beyond the immediate volatility, the structural mechanics of the Bitcoin network and its integration into traditional finance paint a distinct trajectory for the remainder of 2026.
The market is currently digesting the delayed effects of the most recent block subsidy halving. Historically, the true supply shock of a halving is not priced in instantaneously; it requires 12 to 18 months for the reduction in newly minted coins to materially impact the available float on exchanges. As OTC desk inventories deplete, miners are holding fewer coins to cover operational expenses, effectively constricting the daily supply elasticity.
The latter half of 2026 will be defined by the inclusion of spot Bitcoin ETFs into model portfolios by major wirehouses and retirement platforms. Once the Morgan Stanley fee structure normalizes the market, we anticipate the activation of sovereign wealth funds and state pension allocations. These entities operate on multi-year deployment schedules. Their entry will permanently alter the floor price, replacing speculative retail volume with programmatic, price-agnostic accumulation. What would require a fundamental recalibration of this thesis? A sustained breakdown of the $65,000 liquidity floor accompanied by a spike in spot selling volume—rather than derivative liquidations—would indicate structural capitulation. If ETF outflows exceed $500 million over a rolling five-day period, or if a major custodian faces regulatory insolvency, the support thesis would be invalidated, shifting the near-term outlook to aggressively bearish.
The risk-reward ratio at current valuations requires careful monitoring of derivative imbalances and institutional custody flows. A $12 billion short overhang transforms minor price appreciation into explosive upside potential, yet the macro resistance at $72,500 demands respect. Tracking the short-to-long ratio alongside the evolving ETF intake metrics will provide the primary signals for the next definitive price vector. The convergence of algorithmic bid walls and Wall Street fee wars suggests that downside risk is heavily insulated, setting the stage for a volatile, yet structurally supported, final quarter of 2026.
How does the Morgan Stanley ETF fee structure alter institutional Bitcoin allocations? By undercutting competitors like BlackRock by a significant margin, Morgan Stanley effectively lowers the barrier for massive institutional capital. This dynamic forces fee compression across the industry, accelerating long-term holding strategies over speculative trading.
What on-chain signals point toward a potential support base near $65,000? Deep liquidity pools and resting bid walls have congregated around this threshold. Paired with exhausted selling pressure metrics observed by institutional desks, this zone acts as a formidable historical support preventing acute capitulation.
Loading comments...