
Deep Analysis
Bitcoin's 2026 Market Structure: Institutional Accumulation, Brokerage Integration, and the $67K Battleground
April 05, 2026
...


In March 2026, the Ethereum Foundation deployed 72,000 ETH via a simplified distributed validator technology (DVT-lite) setup, intentionally shifting infrastructure operations away from centralized providers to prove that institutional-scale staking can remain decentralized. While this foundational layer hardens network security, the immediate market structure presents a contradictory, highly financialized reality. Ethereum's recent 4.49% bounce from the $2,050 range to its current $2,143 valuation is not being driven by organic spot accumulation, but rather by an aggressive derivatives expansion. The thesis is clear: the current pricing regime is dominated by speculative futures positioning, creating a fragile structural foundation that masks a historic divergence between derivatives leverage and actual spot purchasing behavior.
The recent rebound from the $2,050 support level triggered a localized supply squeeze, yet the underlying capital flows reveal a structural anomaly. On-chain order book data indicates a $104 million divergence in spot buying—the largest negative divergence recorded in three years. Spot cumulative volume delta (CVD) has remained stagnant, while price action has drifted upward. This dynamic occurs when market makers absorb passive spot selling while simultaneously hedging aggressive long exposure in the derivatives market. The absence of sustained spot bidding suggests that the $2,143 support is synthetic, reliant on algorithmic liquidity provisioning rather than long-term institutional accumulation.
Analyzing wallet cohorts provides granularity into the lack of spot participation. Addresses holding between 1,000 and 10,000 ETH have decelerated their accumulation phases, opting for yield-generation strategies over direct market purchases. Exchange outflow metrics, which typically signal accumulation during bullish reversals, have flattened. Instead, liquidity is being routed into collateralized debt positions and margin accounts. When spot volume fails to confirm price appreciation, the resulting market structure becomes acutely vulnerable to sudden liquidity vacuums if the derivatives delta flips.
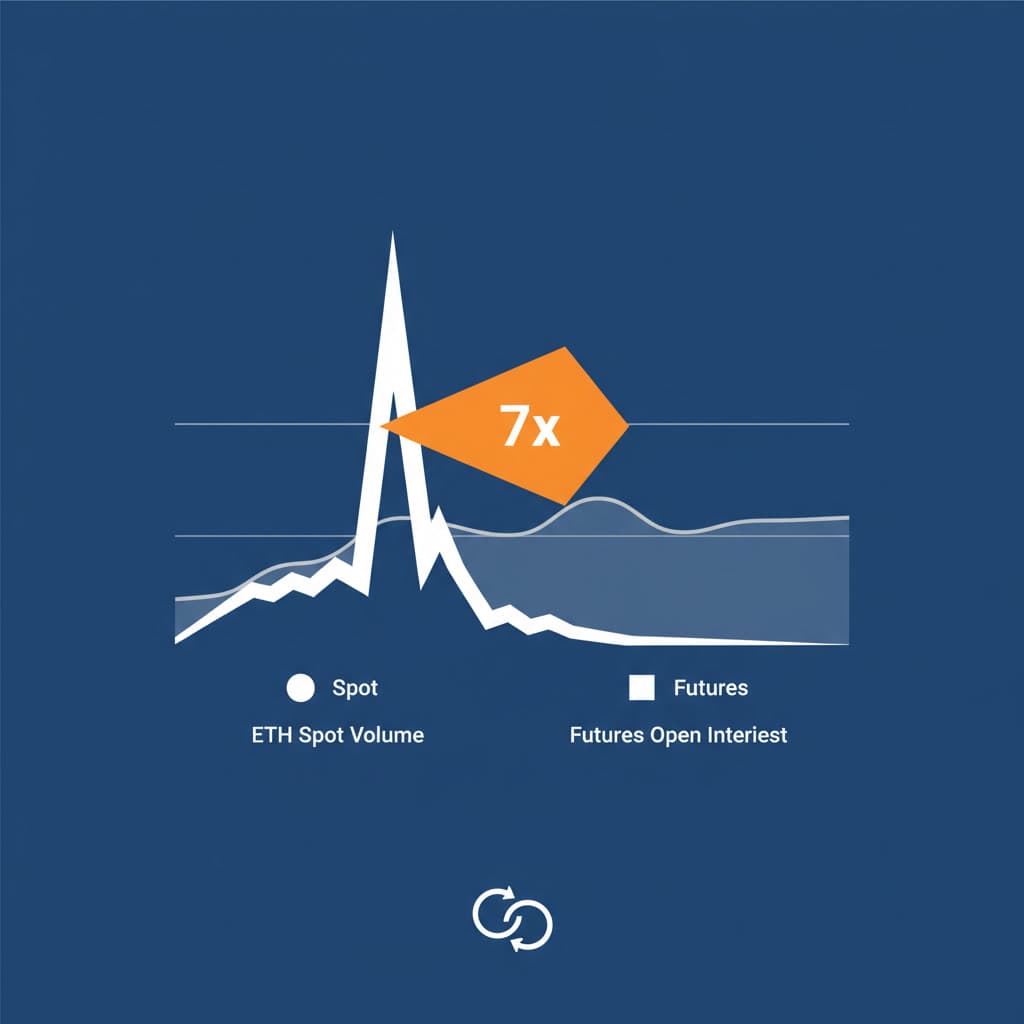
The defining characteristic of the current market structure is the severe imbalance between derivatives and spot activity. Ethereum futures volume currently outpaces spot market volume by a factor of 7x. Open interest across major exchanges, including the CME Group, has expanded disproportionately relative to the underlying market capitalization. This 7x volume divergence indicates that price discovery has migrated almost entirely to the futures market. High leverage ratios elevate the risk of liquidation cascades, as small percentage moves in the spot price trigger outsized margin calls. Funding rates have skewed heavily positive, indicating that speculators are paying a premium to maintain long exposure.
Market cycles defined by extreme futures-to-spot ratios rarely resolve through sustained linear uptrends.
When derivatives dominance exceeds the 5x threshold, the probability of a mean-reverting liquidation event increases statistically. The current 7.1x ratio mirrors the late-stage exhaustion patterns observed in previous cycles, where speculative enthusiasm temporarily overpowers the lack of fundamental spot demand before a violent deleveraging resets the funding baseline.
Despite the fragile trading structure, Ethereum's base layer security metrics exhibit robust institutional participation. The validator entry queue recently experienced significant congestion, absorbing billions in capital commitments, with wait times extending up to 24 days during peak inflows. With approximately 30% of the total circulating supply currently locked in staking contracts, the active supply available for liquid trading continues to contract. Validators are currently realizing an annualized yield of approximately 3.5% to 4.2%, creating a baseline risk-free rate for the Ethereum economy. This high capital lockup rate introduces a structural supply constraint; however, because these assets are illiquid, they cannot provide the immediate order book depth required to absorb sudden futures liquidations.
Liquid Staking Derivatives (LSDs) have fundamentally altered the collateral landscape. Protocols issuing derivative tokens against staked ETH allow capital to be recycled into decentralized finance protocols. While this enhances capital efficiency, it creates nested leverage. A significant portion of the margin supporting the current futures open interest is collateralized by LSDs. If the spot price of ETH experiences a sharp drawdown, the secondary market liquidity for these derivative tokens can fracture, leading to discounted liquidations and exacerbating the downward pressure on the primary ETH spot market.
The current consolidation zone is strictly bounded by historical volume nodes. The $1,800 level represents a macroeconomic floor, defended by substantial institutional cost bases established during the 2024 ETF approval window. Conversely, the $2,500 level acts as a formidable resistance ceiling, characterized by trapped liquidity and historical distribution patterns.
The volume profile between $2,050 and $2,143 is notably thin, creating an air pocket where price can move rapidly in either direction. The lack of dense trading history at the current valuation further supports the thesis that this price point is sustained by derivatives rather than structural support.
Options market makers are currently hedging significant gamma exposure around the $2,200 strike price. As the market approaches major monthly expiries, dealer hedging activities—buying spot when price rises and selling when it falls—amplify local volatility. The heavy concentration of call options at the $2,500 strike creates a "gamma pin" effect, where upward momentum is systematically suppressed by dealers selling the underlying asset to remain delta-neutral.
The regulatory environment has matured significantly since the initial approval of spot Ethereum Exchange-Traded Products (ETPs) in 2024. By late 2025, the U.S. Securities and Exchange Commission (SEC) established generic listing standards, compressing the approval timelines for new digital asset products to as little as 75 days. Despite this regulatory clarity, ETP inflow trajectories have plateaued. Institutional allocators have largely completed their initial portfolio sizing, shifting their focus toward yield-bearing instruments rather than pure spot exposure. The deceleration in net inflows removes a critical source of passive buying pressure that previously absorbed speculative excess.
Ethereum's economic model relies heavily on transaction fee burns to maintain a deflationary supply schedule. The aggressive migration of transaction volume to Layer-2 (L2) rollups has cannibalized base chain revenue. While L2 ecosystems are thriving and capturing significant user activity, the value accrual back to the Ethereum base layer has diminished. The reduction in base fee burns directly impacts the deflationary mechanics, subtly altering the long-term supply dynamics and reducing the fundamental tailwinds that traditionally support higher spot valuations.
The bounce from $2,050 to $2,143 represents a precarious equilibrium. The market structure is bifurcated: a fundamentally secure base layer characterized by record staking participation, juxtaposed against a highly leveraged trading environment heavily dependent on futures speculation. The 7x imbalance between derivatives and spot volume dictates that the next directional move will likely be catalyzed by margin liquidations rather than organic demand. Until spot cumulative volume delta aligns with price appreciation, the structural integrity of the $2,143 support remains questionable.
Falsifiable Claim: The 7x futures volume dominance will result in a long-squeeze liquidation cascade, forcing ETH below the $2,050 local support before any successful test of the $2,500 resistance. Indicators to confirm/refute:
Why is the Ethereum futures-to-spot volume ratio currently sitting at 7x? Institutional hedging and speculative leverage have accelerated, creating a highly financialized environment where derivatives dominate immediate price discovery rather than direct spot accumulation.
What metrics invalidate the thesis for Ethereum reclaiming the $2,500 level? A sustained breakdown below the $1.8K macro support, coupled with mass unstaking events or significant deceleration in Layer-2 transaction fee burns, would signal a bearish structural shift.
Loading comments...