
Deep Analysis
Ethereum Reclaims $2,000: Institutional Analysis of the $46M EF Stake and Impending Volatility
March 30, 2026
...


Institutional allocators face a definitive risk-management juncture heading into Q2 2026: whether to hold, hedge, or offload Solana (SOL) exposure as the asset consolidates at $82.21. Operating as a Senior Quantitative Analyst assessing layer-1 network valuations, I evaluate this technical battleground by crossing on-chain validator economics with recent CoinShares fund flow data. The tension between technically oversold conditions and mounting macroeconomic headwinds requires a strict quantitative framework. The following analysis dissects order book depth, institutional capital flight, and network throughput to determine if the $80 threshold will hold or yield to deeper systemic selling.
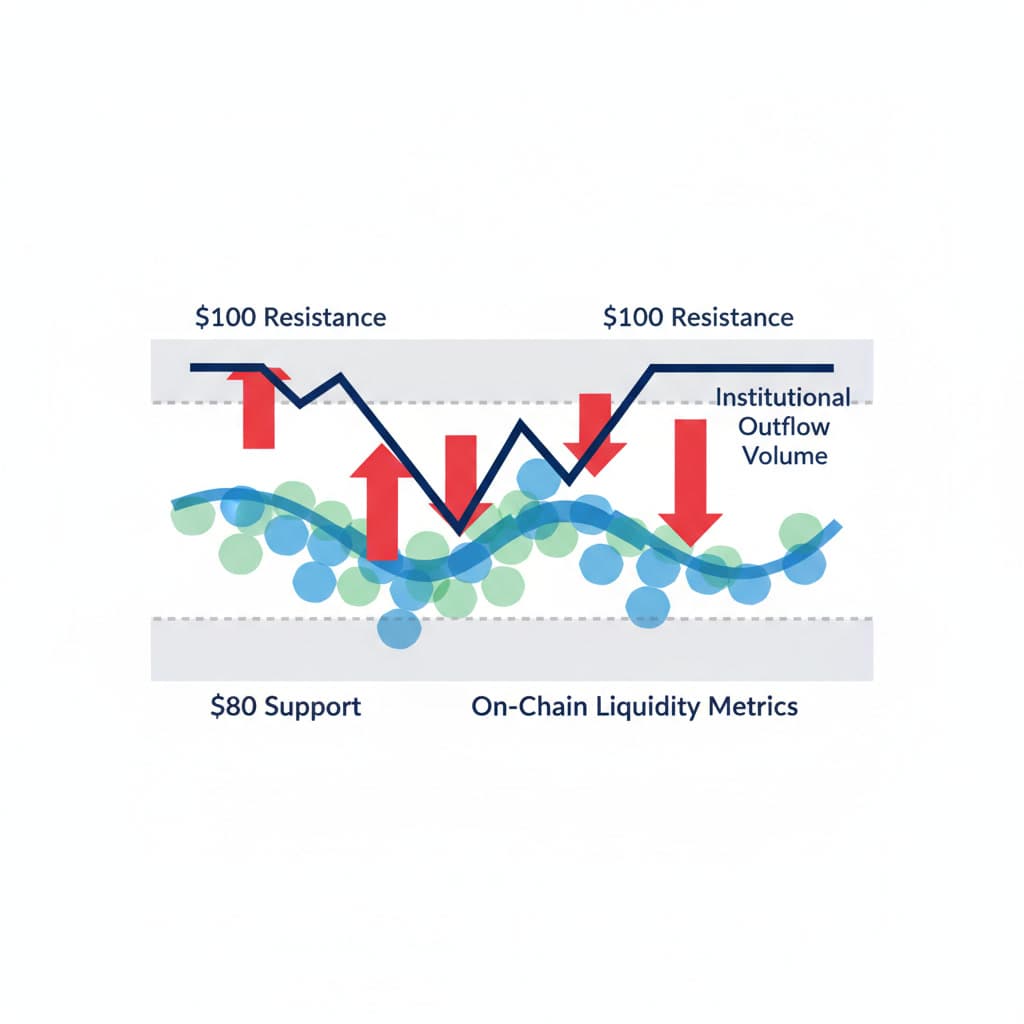
The $80 to $84 corridor is not merely a psychological barrier; it represents a high-density liquidity node established over multiple market cycles. During the initial Q1 2026 correction, this exact range served as the primary defense line against a breakdown toward the February low of $67.44. Market makers have concentrated substantial bid depth here, utilizing the $80 mark to absorb excess supply generated by recent macroeconomic shocks. A definitive daily close below $80 threatens to invalidate the higher-low market structure that has characterized the asset’s recovery phase, exposing the order book to a vacuum of buy-side liquidity.
Momentum oscillators currently signal a severe downward deviation from historical mean valuations. The biweekly Relative Strength Index (RSI) is testing a critical trendline support, aligning with the 0.618 Fibonacci retracement level mapped between $52.11 and $72.55. When cross-referenced with the Supertrend indicator resting at $79.67, the data suggests that downward momentum is decelerating despite recent sell-offs.
Late March 2026 introduced an exogenous shock to the Solana ecosystem via a high-profile corporate treasury loss. Market reports confirmed a major treasury operation suffered a $40.9 million loss linked directly to SOL derivatives and spot exposure. This event serves as a critical case study in institutional contagion. When a treasury of this scale faces forced liquidation, the resulting market order execution drains secondary market liquidity across major exchanges. The immediate second-order effect was a severe widening of bid-ask spreads. Algorithmic market makers, detecting the toxic flow, pulled their quotes, which exacerbated the downward price action and trapped late-stage buyers. This localized liquidation event fundamentally altered the short-term risk profile for other institutional holders, triggering a wave of defensive hedging.
Fund flow data confirms a sharp reversal in institutional sentiment. According to recent CoinShares reports, after seven consecutive weeks of inflows totaling $136 million, Solana experienced sudden outflows of $12.3 million in late March. This capital flight aligns with broader macroeconomic anxieties, specifically shifting FOMC interest rate expectations and geopolitical tensions.
Institutional capital is systematically rotating out of high-beta layer-1 assets and into defensive cash equivalents or stablecoins. This rotation limits the immediate upward price momentum, keeping SOL anchored at market capitalization rank #7.
Despite the bearish price action, underlying network fundamentals reflect sustained operational resilience. DefiLlama data indicates Solana's Total Value Locked (TVL) remains robust at approximately $6.4 billion, supported by significant USDC dominance (52.6%). Decentralized exchange (DEX) volume continues to capture market share from centralized counterparts. The disconnect between a declining token price and stable on-chain utilization highlights a market pricing heavily skewed by macro-driven liquidity constraints rather than protocol-level failures.
Validator profitability is highly sensitive to token price depreciation. The Solana network maintains a Nakamoto Coefficient of 31, with over 1,900 block-producing nodes globally. Client diversity has improved significantly, with Jito Labs capturing over 31% of the network stake. As the SOL price compresses toward $80, the fiat-denominated revenue for independent validators decreases. If the price breaches the $67 threshold, smaller node operators facing fixed hardware and bandwidth costs may be forced to shut down, marginally impacting network decentralization. Looking toward late 2026 and beyond, the network's ability to maintain its high Nakamoto Coefficient will depend heavily on the sustained profitability of these independent node operators. If the multi-client architecture successfully scales without pricing out smaller validators, Solana's institutional appeal as a decentralized settlement layer will strengthen, regardless of Q2 price volatility.
Reclaiming the $100 psychological level requires a specific sequence of liquidity events. First, the spot market must establish a definitive higher low above $84.09 to signal the exhaustion of institutional selling. Second, a resumption of positive net inflows into US spot SOL ETFs is necessary to provide the baseline buying pressure required to clear the $90-$95 resistance block. A shift in macroeconomic sentiment—such as a dovish pivot in forward-looking Fed guidance—would serve as the primary catalyst for this capital reallocation.
Failure to defend the $79.67 Supertrend support exposes the asset to a high-probability reversion to the $67 to $72 accumulation zone. This lower boundary represents the last structural defense before a deeper capitulation toward $50. Risk managers must monitor the velocity of ETF outflows and open interest in derivatives markets. A spike in short positioning combined with a break below $80 would likely trigger algorithmic stop-losses, accelerating the downward trajectory.
Conditions for Thesis Invalidation To maintain strict quantitative rigor, I must outline what would change my mind regarding the resilience of the current support zone.
Falsifiable Claim: The ongoing institutional rotation out of Solana will exhaust itself by mid-April 2026, resulting in a definitive price floor at $79.50 followed by a volume-backed recovery above $90.
Indicators that would refute this claim:
The $80 support level serves as the definitive pivot point for Solana's Q2 2026 trajectory. While network fundamentals, multi-client resilience, and stable TVL provide a strong structural foundation, the immediate pricing environment is dictated by macroeconomic liquidity drains and isolated treasury liquidations. Institutional allocators must weigh the heavily oversold technical indicators against the reality of sustained capital flight. The upcoming weeks will test the depth of the $80 liquidity pool, dictating whether SOL stages a recovery toward $100 or succumbs to a structural reset at $67.
Why is the $80 price level considered a critical support for Solana in April 2026? The $80 threshold aligns with major historical liquidity pools and represents a psychological floor for market participants. A definitive breakdown below this zone exposes the asset to significant downside volume, potentially driving the price toward the deeper $67 support range.
How are institutional outflows affecting SOL's current market capitalization rank? Persistent institutional capital flight drains order book depth and limits upward price momentum. This dynamic is currently keeping SOL consolidated at rank #7, suppressing price action despite underlying network upgrades and technically oversold momentum indicators.
Loading comments...