
Deep Analysis
Bitcoin at $71K: Institutional Capital Shifts and the Decoupling from Tech Equities
March 15, 2026
...


The assumption that passive institutional inflows mechanically drive spot price appreciation is currently being dismantled by Solana’s market structure. Despite U.S.-listed Solana Exchange-Traded Funds (ETFs) capturing an unprecedented 2% of the asset's total market capitalization—surpassing the initial accumulation velocity of Bitcoin ETFs—SOL remains heavily suppressed below the $100 resistance level, trading at $88.45 as of early March 2026. This divergence presents a complex quantitative puzzle. By applying a liquidity flow analysis framework combined with order book depth mapping, this deep dive evaluates the structural forces overriding institutional accumulation. The data reveals that while passive vehicles registered with the U.S. Securities and Exchange Commission absorb circulating supply, aggressive spot market distribution and macroeconomic de-risking are creating a severe friction point for Q2 2026.
The absorption of 2% of Solana’s circulating supply by institutional ETFs marks a structural shift in the asset's float dynamics. According to recent fund flow data from CoinShares, digital asset investment products have seen robust capital allocation, with Solana capturing a disproportionate share of altcoin inflows. When Authorized Participants (APs) create new ETF shares for products like the Invesco Galaxy Solana ETF (QSOL) or the VanEck Solana ETF (VSOL), they must lock up spot SOL with regulated custodians.
Mechanically, this reduces the liquid supply available on centralized exchanges. In a vacuum, this supply shock should compress the order book and force price discovery upward. However, the velocity of these inflows is being tested by the realities of market micro-structure. The 2% threshold is significant because it transitions Solana from a purely retail and venture-dominated asset into one anchored by fiduciary capital, altering its volatility profile and correlation to traditional equities.
The failure of SOL to break the $100 barrier despite record ETF inflows exposes a classic basis trade dynamic and systematic spot distribution. Delta-neutral market makers and hedge funds are actively exploiting the liquidity provided by ETF inflows. A common institutional strategy involves buying the spot asset (or ETF shares) while simultaneously shorting perpetual futures to harvest funding rates, effectively neutralizing the upward price pressure of their spot purchases.
Concurrently, legacy supply overhangs—including programmatic selling from institutional estates and early-stage venture unlocks—are utilizing the ETF-driven bid depth as exit liquidity. Instead of aggressive market buying that consumes the ask side of the order book, ETF inflows are passively absorbing limit sell orders. This transfers millions of tokens from active sellers to passive custodians without moving the marginal price of the asset, resulting in a high-volume, flat-price environment.
On-chain data indicates a surge of 1.1 million new holding addresses in Q1 2026. While raw wallet growth is frequently cited as a bullish metric, quantitative clustering analysis is required to separate genuine retail adoption from sybil activity or algorithmic trading bots.
Evaluating the Gini coefficient of token distribution reveals that a significant portion of these new wallets hold micro-balances, likely associated with decentralized exchange (DEX) aggregators, automated airdrop farming, or low-value non-fungible token (NFT) mints. While this demonstrates the network's capacity to handle high-frequency micro-transactions with negligible fees, it does not translate into the sustained, high-conviction buying pressure required to breach macroeconomic resistance levels. The retail sector is expanding in breadth, but the capital depth per user remains severely constrained by broader economic conditions.
Institutional fiduciaries require infrastructure guarantees before allocating billions in client capital. The historical vulnerability of the Solana network to consensus halts acted as a hard constraint on institutional adoption. This risk profile has been fundamentally altered by the deployment of Firedancer, a high-performance validator client developed in C++ by Jump Crypto.
Case Study: Firedancer and Client Diversity Firedancer bypasses the standard Linux kernel networking stack using custom packet processing (AF_XDP), pushing transaction throughput to the physical limits of modern hardware. More importantly, it introduces critical client diversity. By running a completely independent codebase parallel to the original Solana Labs Rust client, the network effectively eliminates the single-point-of-failure risk that deterred conservative capital.
This architectural redundancy is a prerequisite for the integration of Solana into traditional financial clearing and settlement layers, directly supporting the long-term viability of the ETF products currently accumulating supply.
The macroeconomic environment in March 2026 remains highly sensitive to exogenous shocks. Recent geopolitical escalations, notably the tensions involving Iran, triggered an immediate de-risking event across global risk assets. Although the acute panic has cooled, the secondary effects are visible in on-chain capital flows.
The stablecoin market has expanded significantly during this period. Rather than deploying capital into volatile, high-beta assets like SOL, institutional and large-tier retail investors have rotated into yield-bearing stablecoins. This expansion acts as a liquidity sink. Capital is parked on-chain, earning Treasury-equivalent yields, waiting for a definitive resolution to macro uncertainty. Until the opportunity cost of holding risk-free fiat proxies declines, this sidelined capital will not rotate back into spot SOL.
Solana does not trade in isolation. Recent data highlights rare, same-day outflows across U.S. crypto ETFs, including Bitcoin and Ethereum products. During periods of macroeconomic stress, algorithmic trading desks treat the entire digital asset class as a single high-beta technology proxy.
When Bitcoin ETFs flash red, automated systems execute cross-asset liquidations to maintain portfolio delta targets. Because Solana historically exhibits a higher volatility multiplier relative to Bitcoin, it suffers disproportionate spot selling during these algorithmic drawdown events. The regional divergence is also stark; while U.S. markets have shown intermittent resilience, APAC trading hours have consistently seen localized spot distribution, capping intraday rallies and reinforcing the heavy resistance below $100.
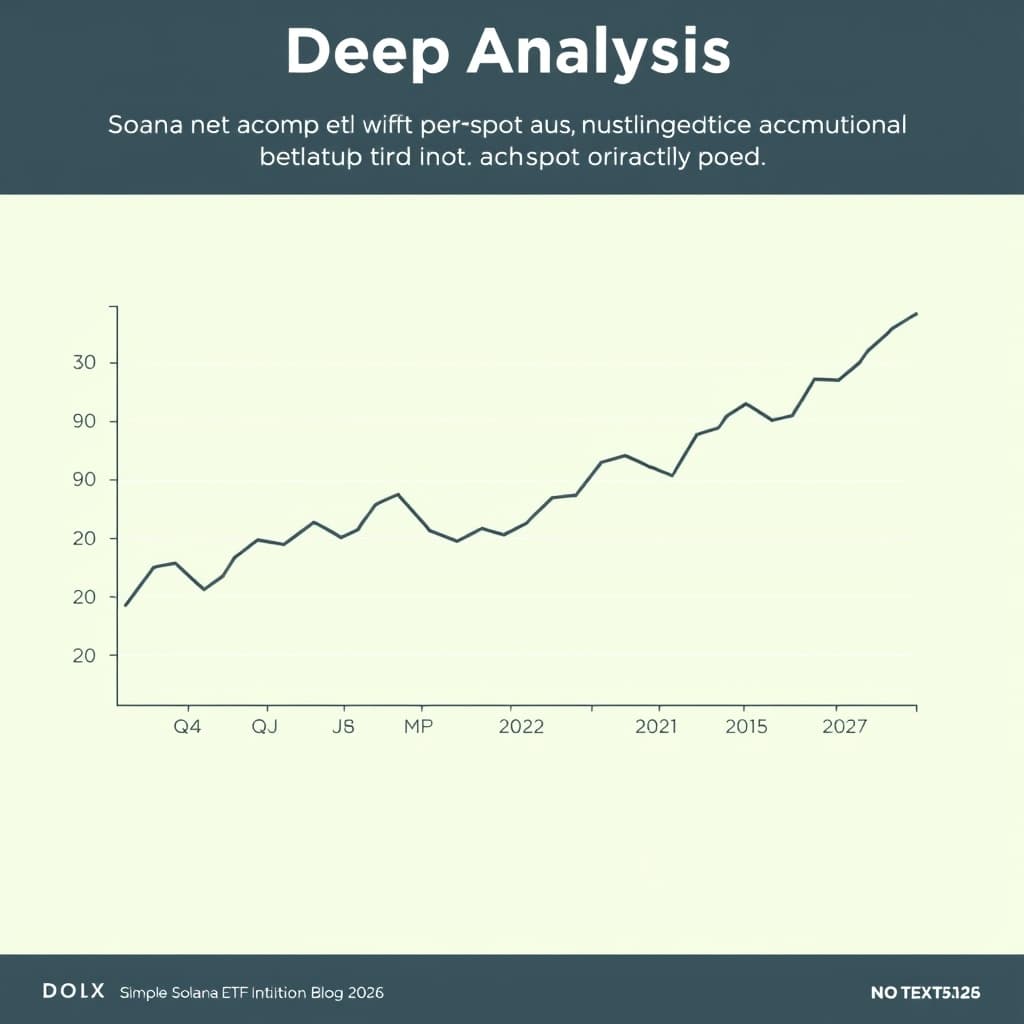
At the current price of $88.45, SOL is trapped in a contracting volatility band. Volume Profile Fixed Range (VPFR) analysis across the Q4 2025 to Q1 2026 dataset identifies a severe lack of historical liquidity between $84 and $65.
If the immediate support at $84.62 fails, the order book vacuum suggests a high probability of rapid price depreciation down to the $60 level. This $60 threshold is not arbitrary; it represents the largest volume node established prior to the ETF approval sequence. It is the baseline where institutional accumulation initially began, making it a definitive structural floor. A breach of $60 would signal a complete failure of the ETF accumulation thesis.
Reclaiming the $100 mark requires more than passive ETF inflows; it demands an unwinding of the current basis trade and a resurgence of active spot market buying. Market participants are currently forced to weigh the execution friction and counterparty risks of various exposure vehicles.
For the $100 resistance to break, the capital efficiency of perpetual futures must become less attractive than holding the spot asset. This typically occurs when funding rates flip negative for an extended period, forcing short sellers to cover their positions, thereby generating the aggressive market buying necessary to consume the overhead supply.
A structural invalidation of this cautious quantitative outlook would require a definitive shift in the macroeconomic regime—specifically, a surprise dovish pivot by the Federal Reserve accompanied by a sharp decline in the US Dollar Index (DXY). If the baseline cost of capital drops aggressively, the current spot distribution would likely be absorbed by leveraged retail re-entering the market, rapidly compressing the basis trade and forcing a violent short squeeze through the $100 volume node.
The divergence between Solana's record-breaking ETF inflows and its stagnant spot price is a mechanical outcome of institutional hedging, legacy supply distribution, and macroeconomic de-risking. While the addition of 1.1 million new wallets and the successful integration of the Firedancer client solidify the network's fundamental health, these factors are currently subordinate to global liquidity constraints. Institutional investors must monitor the $84 support level closely; failure here exposes the asset to a rapid descent toward the $60 volume node, while a breach of $100 remains entirely dependent on the unwinding of institutional short-delta hedges.
Why is Solana's price struggling despite record ETF inflows?
Institutional accumulation via ETFs is currently being offset by broader macroeconomic de-risking and significant spot market selling pressure, creating a temporary divergence between passive institutional sentiment and immediate price action.
What makes the $100 price level a critical technical threshold for SOL?
The $100 mark serves as both a heavy psychological resistance and a historical volume node. Breaching it requires a definitive shift in macro sentiment and sustained spot buying volume to complement the existing passive ETF inflows.
Loading comments...